الاثنين، 22 يوليو 2013

More Than Meets The Income Statement At EPIQ Systems


EPIQ Systems (EPIQ), a legal technology solutions provider, has misleadingly high reported earnings due to a funny accounting rule. Analysts and investors looking at reported earnings have assigned unreasonably high expectations to EPIQ. Both the implied expectations in its valuation and the explicit earnings estimates require an unrealistically high amount of profit growth. While GAAP data shows growing profits, deeper analysis of the footnotes reveals a company with shrinking margins and flat profits.
Misleading Income Red Flags  
Contingent considerations are conditional payments that only occur if a certain target is met. The company is required to record the value of the contingent consideration (cost of consideration times probability the target is met) as a liability. The buyer then must remeasure the fair value of the contingent consideration in each reporting period.
Significant changes in the probability of the target being met can lead to large swings in the fair value of the contingent consideration, which is then recorded as either income or expense. In the last fiscal year, 57 different companies recorded income from fair value adjustments to contingent consideration.
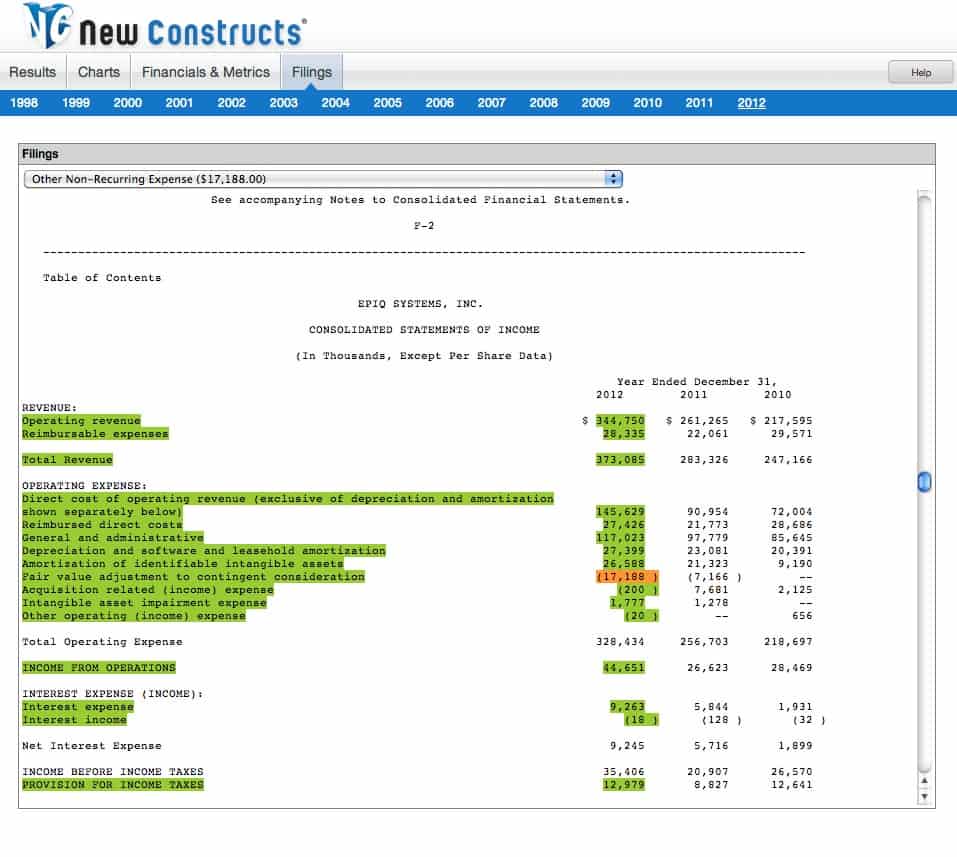
In 2012, EPIQ recorded $17.2 million in income from fair value adjustments to contingent considerations. De Novo Legal, which EPIQ acquired in 2011, did not meet the revenue target required to trigger a contingent consideration payment. A large contingent consideration adjustment like this one artificially inflates earnings and signals to investors that an acquisition was not as successful as the company anticipated.
Fortunately for investors, that $17.2 million is disclosed directly on the income statement for investors to find and remove (though some analysts, like the author of this Motley Fool article, still rely directly on unadjusted GAAP income). There is more income from contingent consideration hidden in the footnotes, though.
Buried on the 87th page (and the 39th page of footnotes) of EPIQ’s 2012 Form 10-K is the disclosure that “$3.4 million of accrued compensation expense was reversed” in 2012 based on revaluation of another compensation-related contingent consideration. Hidden within “general and administrative” expenses on the income statement, this items is found only in the footnotes. Without proper diligence in the footnotes, investors would never know that 15% of EPIQ’s 2012 GAAP net income in 2012 came from a non-recurring item.
Declining Margins
Figure 1 shows EPIQ’s margins declining since 2006. After-tax profit (NOPAT) is lat while revenues rise.
The spike on that graph in 2006 represents the peak of bankruptcy filings, a key part of EPIQ’s business. Since then, bankruptcies have been in decline, decreasing by 23% over the past two years alone.
EPIQ’s bankruptcy segment is its highest margin segment, accounting for 26% of revenue and 33% of net income in 2012. Over the past two years, revenue from EPIQ’s bankruptcy segment has declined by 9%.
The bullish case for EPIQ is based largely around its eDiscovery segment. The electronic discovery industry is growing rapidly, and EPIQ’s revenue growth in recent years has been driven almost entirely by eDiscovery. Unfortunately, the eDiscovery market is highly competitive with low differentiation, hence the declining margins in Figure 1. It is not the profit savior investors need to justify the profit growth expectations in the stock.
Unreasonable expectations
Too often, analysts and investors base their expectations off reported earnings without adjusting out non-recurring items and looking at return on invested capital (ROIC). EPIQ had reported earnings of $22 million last year, while its true operating profit (NOPAT) was 27% less at $16 million. Its ROIC, the truest measure of efficiency and profitability, was a bottom-quintile 3%. Its economic earnings, the true, apples-to-apples measure of profits after footnotes adjustments, were -$26.7 million.

Washington Can't Defuse The Ticking Time Bombs Fannie Mae And Freddie Mac


annie Mae (the Federal National Mortgage Corporation) and Freddie Mac (the Federal Home Loan Mortgage Corporation) were definitely players in the financial crisis. No one disputes that, but there are very different, usually partisan opinions about how much they contributed to the crisis and how to fix them. That’s no doubt why they aren’t mentioned in Dodd-Frank. The political divide on them might well have torpedoed the entire bill.This is the fourth in an 11-part series on the failed promises of the Dodd-Frank financial reform package and the continued, dangerous imbalances in our financial system.
I’ll quote from both the majority and minority FCIC reports to frame the Fannie Mae-Freddie Mac problem. The majority report said, “These GSEs [Washington-speak for Government Sponsored Enterprises] had a deeply flawed business model as publicly traded corporations with the implicit backing of and subsidies from the federal government and with a public mission. Their $5 trillion mortgage exposure and market position were significant. In 2005 and 2006, they decided to ramp up their purchase and guarantee of risky mortgages, just as the housing market was peaking…
“They used their political power for decades to ward off effective regulation and oversight—spending $164 million on lobbying from1999 to 2008. They suffered from many of the same failures of corporate governance and risk management as the Commission discovered in other financial firms…
“Through the third quarter of 2010, the Treasury Department had provided $151 billion in financial support to keep them afloat…
“We conclude that these two entities contributed to the crisis, but were not a primary cause. Importantly, GSE mortgage securities essentially maintained their value throughout the crisis and did not contribute to the significant financial firm losses that were central to the financial crisis. The GSEs participated in the expansion of subprime and other risky mortgages, but they followed rather than ledWall Street and other lenders in the rush for fool’s gold. They purchased the highest rated non-GSE mortgage-backed securities and their participation in this market added helium to the housing balloon, but their purchases never represented a majority of the market.”
The minority report concluded: “The government-sponsored enterprises Fannie Mae and Freddie Mac were elements of the crisis in several ways:
* They were part of the securitization process that lowered mortgage credit quality standards.
* As large financial institutions whose failures risked contagion, they were massive and multidimensional cases of the too big to fail problem.
* Policymakers were unwilling to let them fail because:
– Financial institutions around the world bore significant counterparty risk to them through holdings of GSE debt;
– Certain funding markets depended on the value of their debt; and
– Ongoing mortgage market operation depended on their continued existence.
• They were by far the most expensive institutional failures to the taxpayer and are an ongoing cost.
“These two firms were guarantors and securitizers, financial institutions holding enormous portfolios of housing-related assets, and the issuers of debt that was treated like government debt by the financial system. Fannie Mae and Freddie Mac did not by themselves cause the crisis, but they contributed significantly in a number of ways.”

4 Stocks To Take Advantage Of An Improving Economy


Randell Cain, CFA, Portfolio Manager, Aston/Herndon Large Cap Value Fund
Randell Cain:  The market that we’ve been in going back to mid-March of 2009 has really been almost one directional — and that’s been up.  This has been a very positive thing clearly for those who have been willing to stick out some of the negative sentiment and negative comments that have been made about the market.  The gradually improving economy and the stock market being at very low levels in terms of valuation have provided some really neat opportunities.
We’ve been able to do fairly well for our clients in this environment and we still think that the market is well positioned where it is right now — although we do think there’s a transition taking place.  And the transition taking place is really one where the defensive orientation that investors have been taking has prevented them from investing in the more cyclical areas of the economy.  As a result, certain sectors have become overvalued and getting too much attention.  Other areas are still pretty attractive.
Wallace Forbes:  Which areas are getting too much attention and which too little?
Cain:  Well, the areas that we think garner too much attention for a variety of reasons including their defensive orientation and the yields associated with them are the utilities, the telecoms, some parts of consumer staples that are a bit more domestic oriented, healthcare, and predominately the large-cap pharma companies.  And right now you’re still seeing some residual effect of that with some of the financials — which are clearly doing better fundamentally.  But we believe a lot of that good news has been priced in.
Forbes:  So those are all areas that you feel are fully priced or overpriced?
Cain:  Yes.
Forbes:  What are the ones that look good to you?
Cain:  Well, the ones that are looking good to us right now are those more cyclical areas such as energy, materials, technology, consumer discretionary and, although I’ve mentioned consumer staples, it’s more the multinational names that are of interest to us there.  Those five sectors are where you would see overweights in our portfolio, whereas the others would be underweighted and industrials being about market weighted.
Forbes:  Very clear backgrounding.  Now what specific stocks do you like or not like?
Cain:  I would categorize it more in terms of the overweights and the underweights that we have.  It’s almost been like a barbell approach to some degree.  While we’re not as extremely overweight as we were at one time, we still have our most significant exposure in the energy space.
We’re experiencing an improving economy domestically.  Some people disparage the success we’re having economically and call it, “The best house in a bad neighborhood.”  I look at it from the perspective that at one time we were going into the recessionary period and you had the non-U.S. developed markets as well as developing markets that were then doing better.
We were considered to be more of the tail of the dog.  Now it appears that we’re kind of becoming more the dog and these other countries are lagging behind us and becoming the tail.  Nevertheless, there’s a yin and a yang in the fluctuation of the economies and, over time, the leader tends to pull the others in that direction.
To some degree, I believe the U.S. economy led the others into a recession and now I believe that the U.S. economy will gradually lead these other countries out.  As a result, there are certain areas where demand will pick up.
You’ve already seen oil prices that have moved up probably much higher than what many other market prognosticators would suggest that they should be.  But you haven’t seen energy as being a market leader in terms of stock market performance.  Some areas have been compromised a bit, such as the refiners, which had a really strong 2012.  They started off the year well but they’ve given some back of late because of differentials between West Texas Intermediate — our domestic proxy for oil prices — and Brent — the international proxy.  That spread has collapsed.  What you see when that happens is that profitability goes down.  In addition, there are concerns that that is something that may be more persistent with the refiners given that spreads were at one time quite wide.

How Your VantageScore Credit Report Is Calculated


Since the 1970s, credit scores have played an increasingly vital role in the lending industry. Fair Isaac and Company began assigning credit scores to consumers based upon various factors over 40 years ago, and these scores are now reviewed not only by prospective lenders, but also by landlords, insurers and governmental agencies. But the computation process for the FICO score has some limitations; for example, a consumer has to have a credit line open for at least six months before it will show up on a FICO credit report. This and other deficiencies have led the three major bureaus to establish a new credit score model known as VantageScore, which evaluates customers according to a somewhat different set of criteria that can be much more forgiving in some instances.
A Collaborative Effort
The three major credit bureaus have used the FICO scoring model for decades, but the differences in how each agency computes its scores has led to numerous discrepancies that are often problematic for both lenders and consumers. The VantageScore model is designed to provide a much more standardized grading system than the one used by Fair Isaac and Company. The first version of Vantage appeared in 2006, followed by Vantage 2.0 in 2010, which was modified in response to the changes that swept over the lending industry after the Subprime Mortgage Meltdown of 2008.
The VantageScore Model Methodology
VantageScore credit scores are computed in a fundamentally different manner than FICO scores. They start with a somewhat different set of criteria than FICO and also assign a different weighting to each segment. A comparison of the two is shown as follows:
FICO Score
  • The Consumer’s Payment History: 35%
  • Total Amounts Owed by the Consumer: 30%
  • Length of the Consumer’s Credit History: 15%
  • Types of Credit Used by the Consumer: 10%
  • Amount of the Consumer’s New Credit: 10%
VantageScore
  •  Amount of the Consumer’s Recent Credit: 30%
  • The Consumer’s Payment History: 28%
  • Utilization of the Consumer’s Current Credit: 23%
  • Size of the Consumer’s Account Balances: 9%
  • Depth of the Consumer’s Credit: 9%
  • Amount of the Consumer’s Available Credit: 1%
The VantageScore model is also quantified differently than FICO scores. It still uses a numerical range for its scores, but it also assigns a corresponding letter grade for a given range, in some instances, that helps consumers to understand the quality of their score. The grade is statistically based upon the ratio of consumers who are likely to charge off versus those who will pay on time. The VantageScore system is broken down as follows:
  • 901 to 990 = A – 1 charge off for every 300 consumers who pay on time
  • 801 to 900 = B – 1 charge off for every 50 consumers who pay on time
  • 701 to 800 = C – 1 charge off for every 10 consumers who pay on time
  • 601 to 700 = D – 1 charge off for every 5 consumers who pay on time
  • 501 to 600 = F – 1 charge off for every 1 consumers who pay on time
As with FICO, the consumer’s creditworthiness matches his or her score and grade. Each of the three major credit bureaus computes a score based on the VantageScore model using its own data. Of course, while all three bureaus use the exact same model to compute the VantageScore credit score, it can still differ from one bureau to another because each bureau typically records slightly different information in their consumer files.
The VantageScore Benefit
One of the chief advantages that the VantageScore model brings is the ability to provide a score to a large segment of consumers (about 30 to 35 million) who are currently unscorable when traditional methodologies are applied. The VantageScore model differs from FICO in that a line of credit only has to be open for a single month in order to be factored in, yet this model takes 24 months of consumer credit activity into account, whereas FICO only looks back for six months. The longer look back period can be a big help for consumers who are working to rebuild their credit and are able to show a marked improvement over the longer time span. The VantageScore credit score is also designed to serve as a “predictive score” for those with thin credit histories by indicating the probability that they will meet their future payment obligations in a timely manner. It can also use rent and utility payments in its computations if they are reported by the landlord and/or utility provider.
VantageScore 3.0
The most recent version of the VantageScore model represents a substantial improvement over the previous two models. It was created beginning with over 900 data points from 45 million consumer credit files spanning two overlapping time frames from 2009 to 2012. However, it only uses about half the number of reason codes (which signify various reasons why the consumer’s credit score carries the number that it has been assigned), and these codes have been rewritten in plain language that consumers can easily understand. VantageScore Solutions, the company behind the model, also provides an online resource where consumers can look up their reason codes, which can be found at www.reasoncode.org.
As mentioned previously, the risk assessment formula that is used in the model is now identical for each of the major bureaus because it employs uniform definitions for consumer payment and credit information that is received by each bureau. The VantageScore model also claims that the predictive score in this version will be 25% more accurate than the previous one due to the substantial increase in both the quality and quantity of data upon which the model is based.
Impact with Lenders
Despite the hype with which the three credit bureaus have promoted their new scoring system, it has been slow to catch on in the lending industry. The VantageScore model remains a very distant second to the traditional FICO score in the amount of market share that it has carved out among lenders. As of April 2012, less than 6% of the credit scoring market and only 10% of the major banks use the VantageScore model in their underwriting.
The Bottom Line
Although its method of computation is considered to be more fair and realistic than the FICO model, it will likely take some time for lenders to become comfortable with shifting to this alternative methodology. Nevertheless, the number of institutions that accept the VantageScore model is growing, and its popularity will likely continue to increase with its ability to tap a new market of potential lending customers. For these reasons, the major credit bureaus continue to view VantageScore credit scores as a model for the future.

Wealth Means Having No Financial Limits And $1M Is Not Enough, Millionaires Say

A dollar isn’t what it used to be, and neither is one million dollars apparently.
That’s according to about 4,500 investors surveyed by UBS UBS +2.9% who say wealth comes at the $5 million mark. Anything under that and chances are you won’t feel wealthy.
But perhaps more insightful is how those surveyed define wealth: It’s not about an amount of money but rather wealth means having no financial constraints. Some 50% of participants said they view wealth as having no financial constraints on their activities.
The numbers represent investable assets only meaning real estate assets are excluded from wealth estimates. Those surveyed had at least $250,000 in investable assets and half had at least $1 million in investable assets.
Ten percent said wealth means never having to work again and another 10% said it means ensuring a comfortable lifestyle for generations ahead.
Indeed, four out of five investors are providing financial support for adult children or aging parents, and one in five is sharing a home with those adults, according to UBS.
“Unemployment, the economy and aging parents make concerns about the financial situation of family members significant. In fact, investors’ second-biggest personal finance concern is the financial situation of their children/grandchildren (58% of those with children are concerned, behind being able to afford the healthcare and support needed in old age),” the survey says.
Many are helping their children or parents pay for minor expenses like groceries and phone bills (54%), education costs (42%) and helping them borrow (20%).
For these millionaires, helping out their adult children and parents doesn’t seem to be much of a hardship. “While even high net worth investors can be financially strained by this type of help, and they tend to provide support more out of financial necessity than preference, most investors enjoy financially helping their grandchildren (82%), their adult children (76%) and their parents (59%),” the study notes.